Arrhythmia Monitoring Device Illustration
Objective
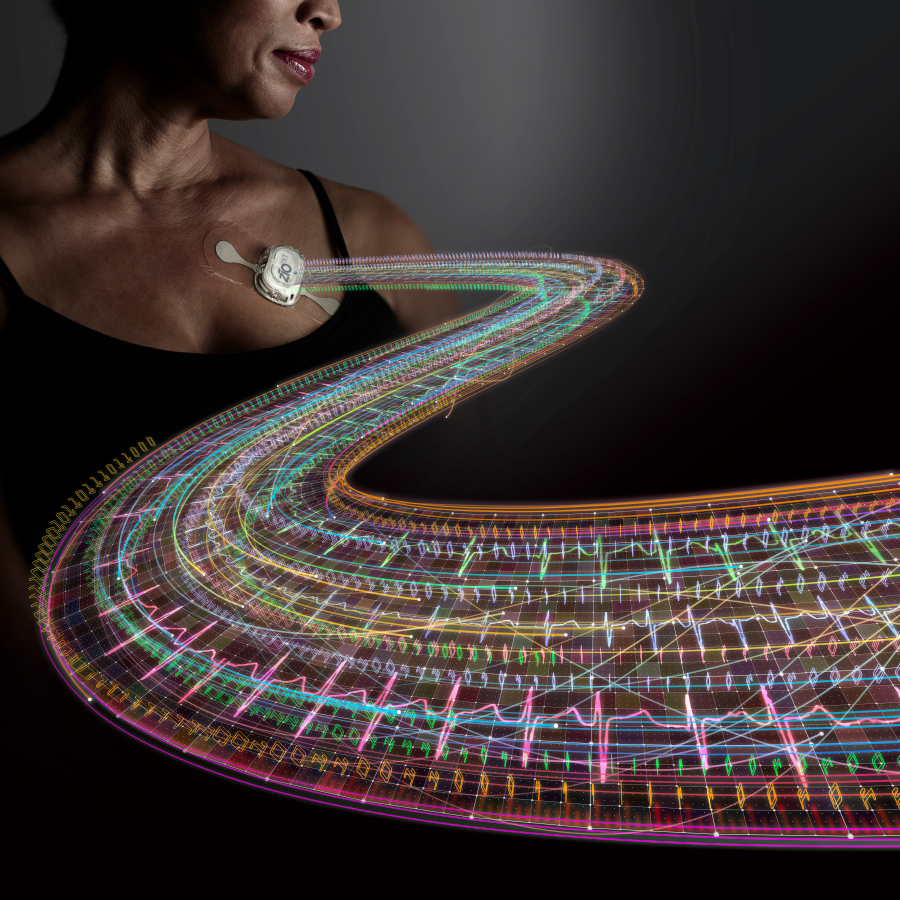
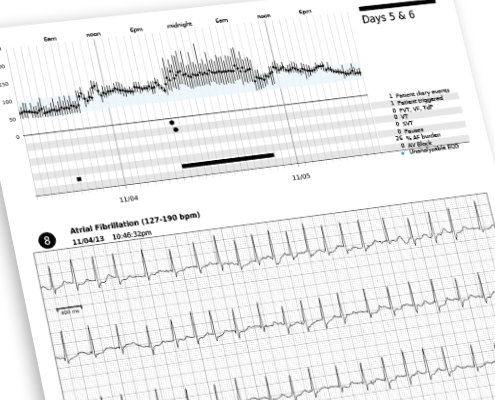
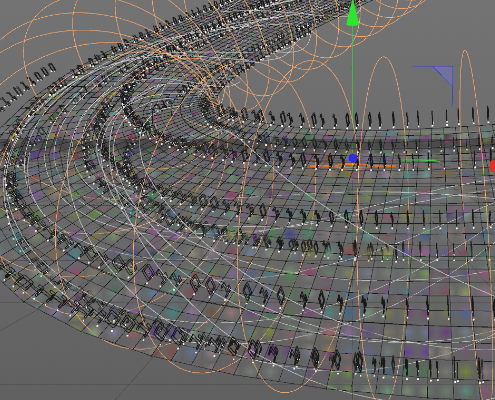
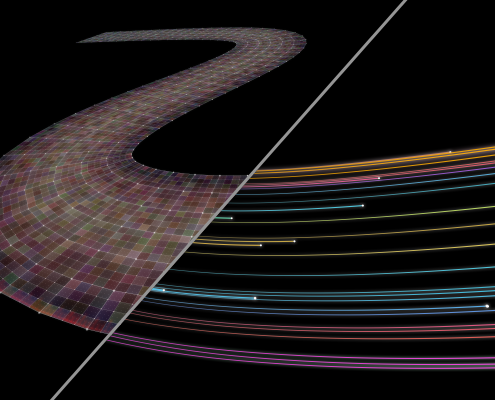
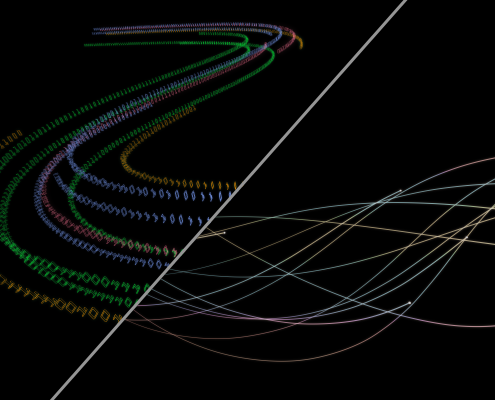
Create a vibrant flow of data from an arrhythmia monitoring device, showing how the device delivers a long-term flow of data. The main real thing to include were arrhythmic ECG lines and a representation of the graph that the lines are typically shown. Then add colored flows and lines to represent data being captured and relayed.
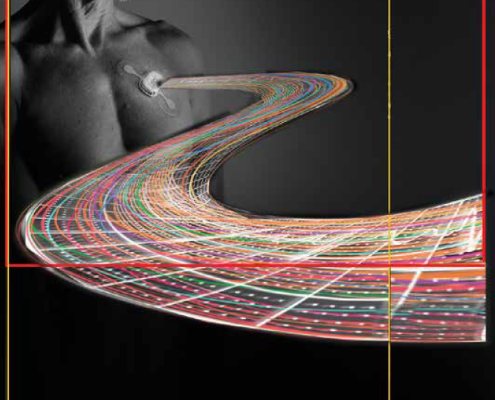
A man and a woman were photographed and the data flow art was created to be cropped vertically, horizontally, and square.

